Notes for At-sea Troubleshooting
Things to do / have ready in advance of departure:
- Spare ethernet cable
- On your laptop (Windows), having these installed would be potentially helpful:
- Make sure you know the admin password for the server (command line access).
Error Messages
Whenever you get an error messages like this:

It is best not to ignore it. It means there is a background process that failed and we should figure out what it was. Contact your Andes support people and take a screenshot of the bottom of the server logs as soon as possible. See the section below on accessing the logs.
How to Restart the Server
Here is how you restart the server:

You will know that you were successful because the website will go down for a few minutes.
GPS / Navigation Data Not Working
If the navigation is not being recorded you will see a yellow flashing icon in the nav bar:

The first step to solving the problem is to figure out where the problem is.
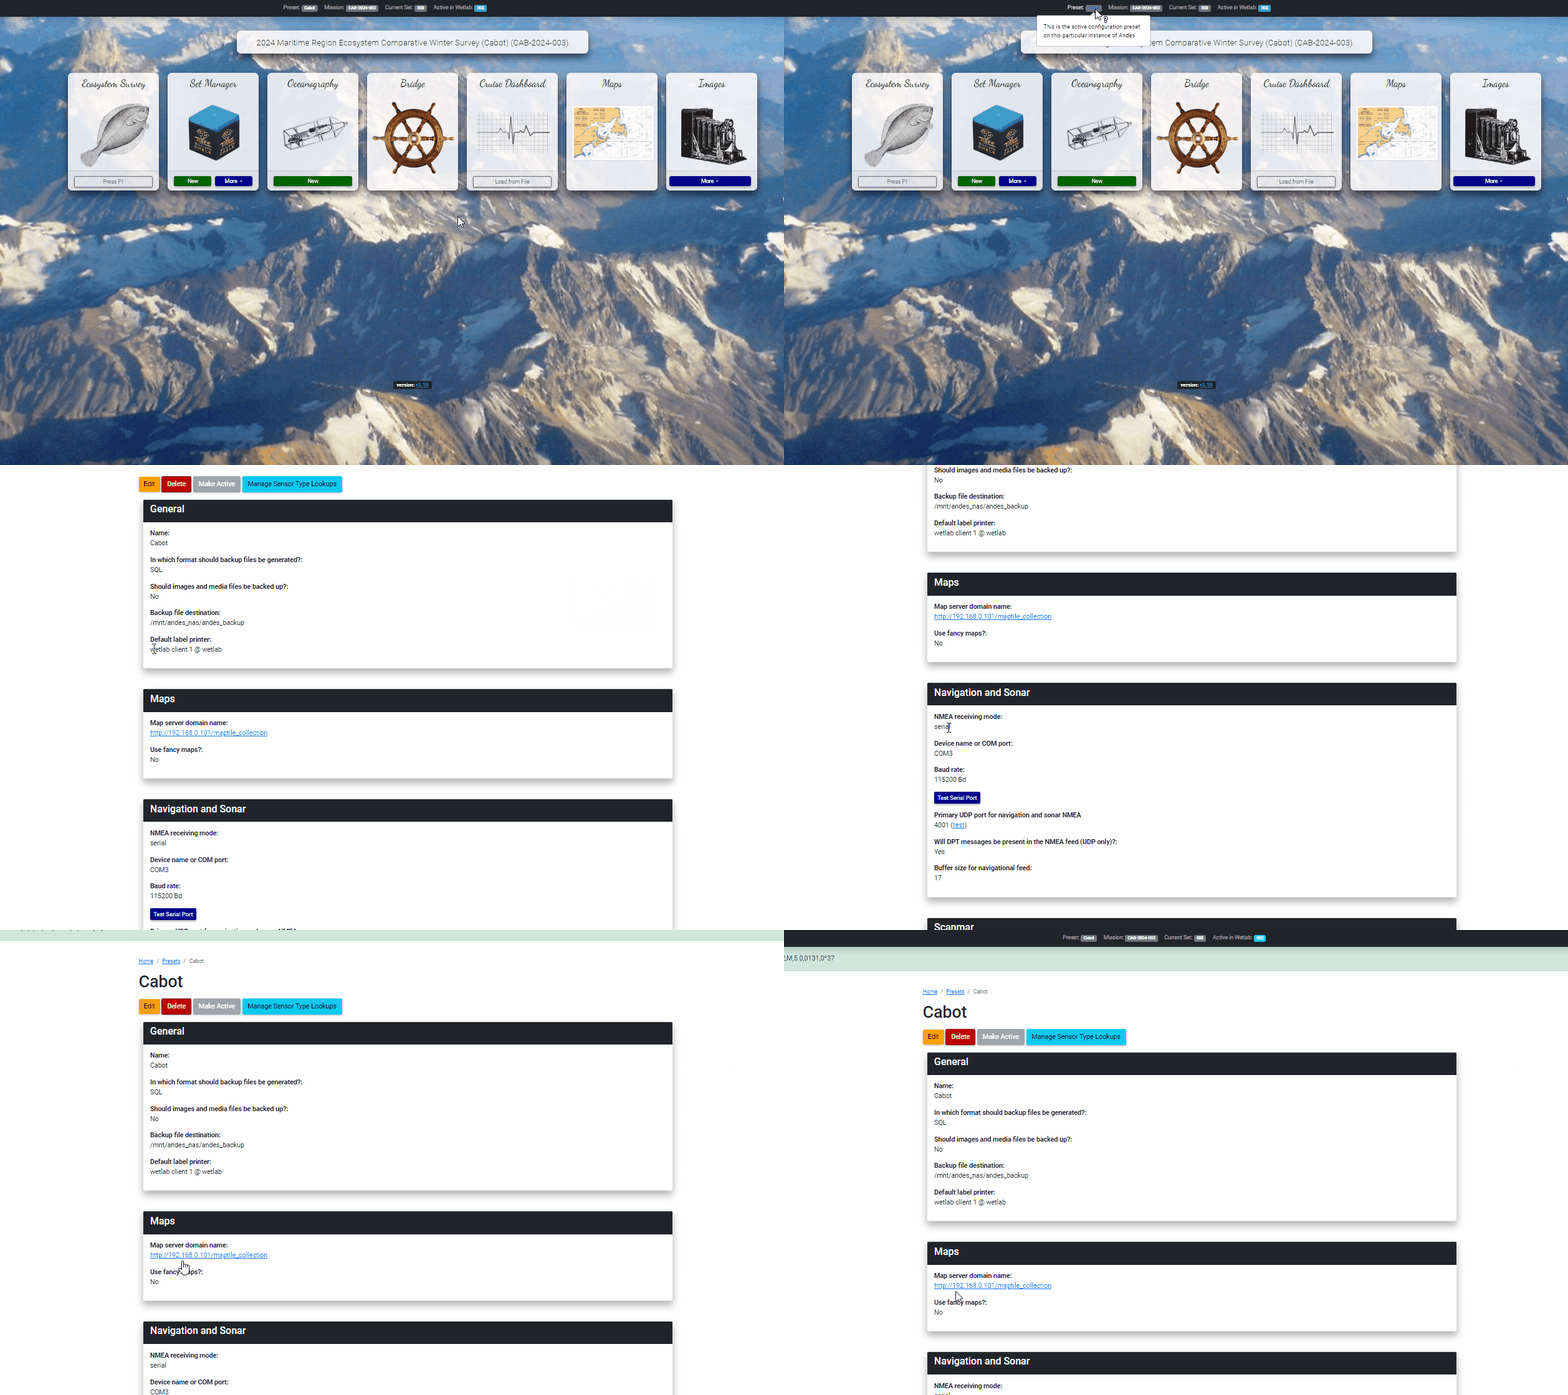
Go to the vessel’s configuration in Andes to see if any data is coming in over the UDP or serial port. Also, take note of the current NMEA receiving mode.

If you DO NOT see a green banner
If you do not see a green banner, as shown in the GIF above, it means the NMEA input is not making its way to the server. If you are depending on the EK80 to relay navigation and depth data, make sure the EK80 is correctly configured.
Here is also a link to the EK80 docs. If the EK80 is off, you will get no navigational data.
If you are receiving data via serial connection, make sure the cable is properly connected to the Andes server. In most cases, you should see a USB / serial dongle that is plugged into the server. Flashing lights on the dongle is usually a good thing.
If none of the above works, try restarting the computer (see above)
If you see a green banner
This means that the NMEA data is arriving to the server but for some reason Andes is not recording it. This is likely because the background processes that are responsible for listening and recording these data have crashed. The first course of action if this happens will to restart the background processes via the Shell Script page:

If this does not work, try restarting the server.
Certain sensors / data types (e.g. speed over ground or depth) are not being recorded often enough
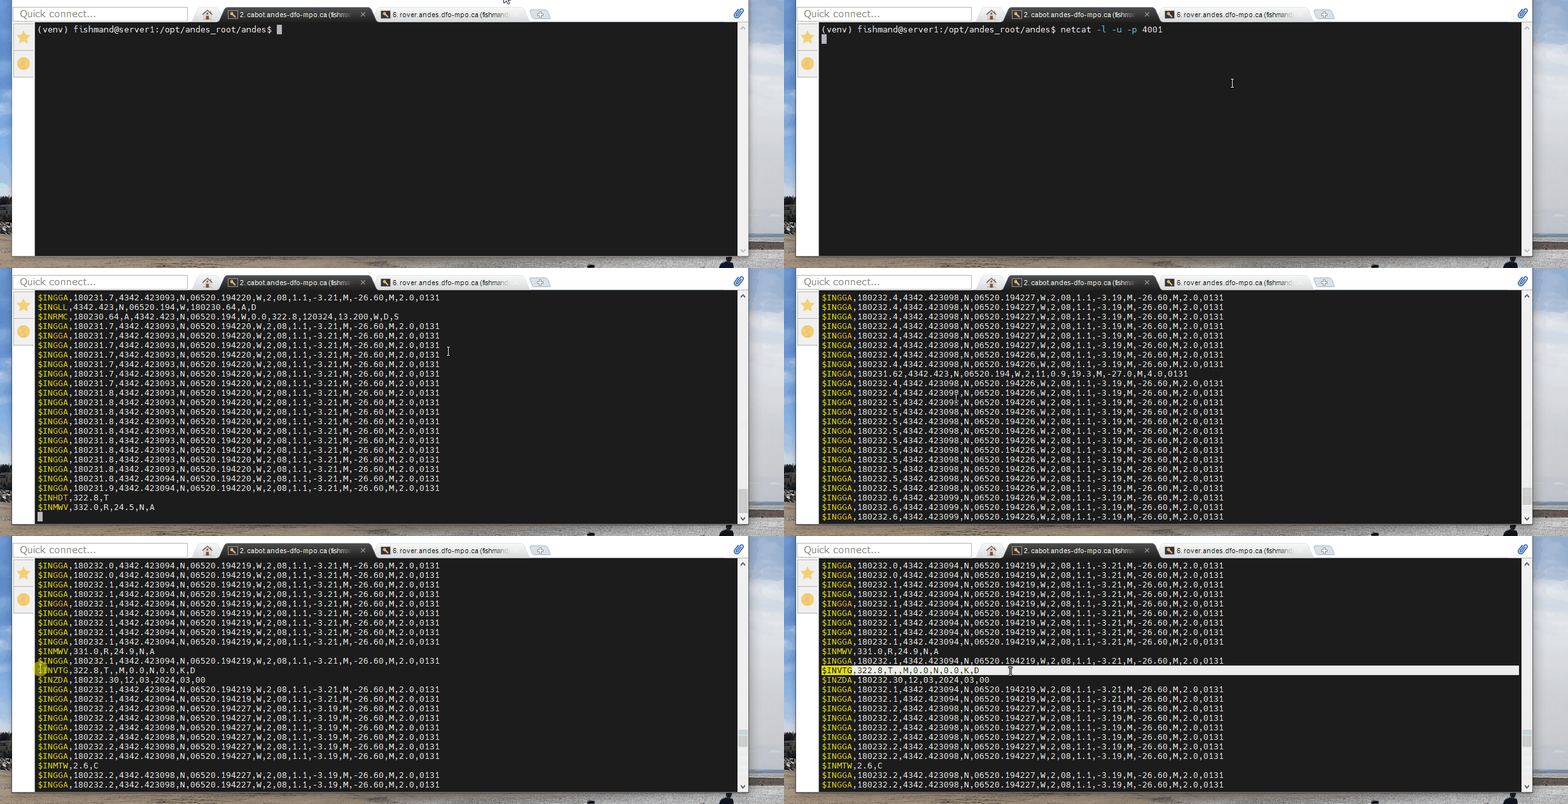
When this happens, it might be caused by messages occurring infrequently in the data stream

In this GIF, we see how most of the data stream is GGA messages and the VTG messages are relatively scarce. One option for dealing with this is to increase the size of the buffer in the vessel Configuration menu. The buffer is the number of NMEA messages andes will collect before “digesting” them. If the buffer is too small, we might miss out on certain, infrequent messages. However, if the buffer is too large, Andes may fall behind in data collection. The idea buffer size will be determined by how many different messages you are looking for, how common they are and the rate of transmission.
If you are missing depth, make sure your EK software is configured correctly.
Finally, make sure you have the follow field set to “yes” in the vessel’s configuration

How to log on to the server (connecting via SSH)
SSH is a way to remotely connect to the command line of another computer.
Via command line
Enter the following command in the command prompt:
ssh admin_andes@192.168.0.100
Next, enter the password. You will not see yourself type.
Sometimes you will get a messages that you cannot connect because something about the host identity has changed. When this happens, you will have to delete a file and then try again. Here is the command for deleting the file:
del \Users\fishmand\.ssh\known_hosts
Make sure to swap out the path to your user’s home directory. After running this, you can try the ssh command again.
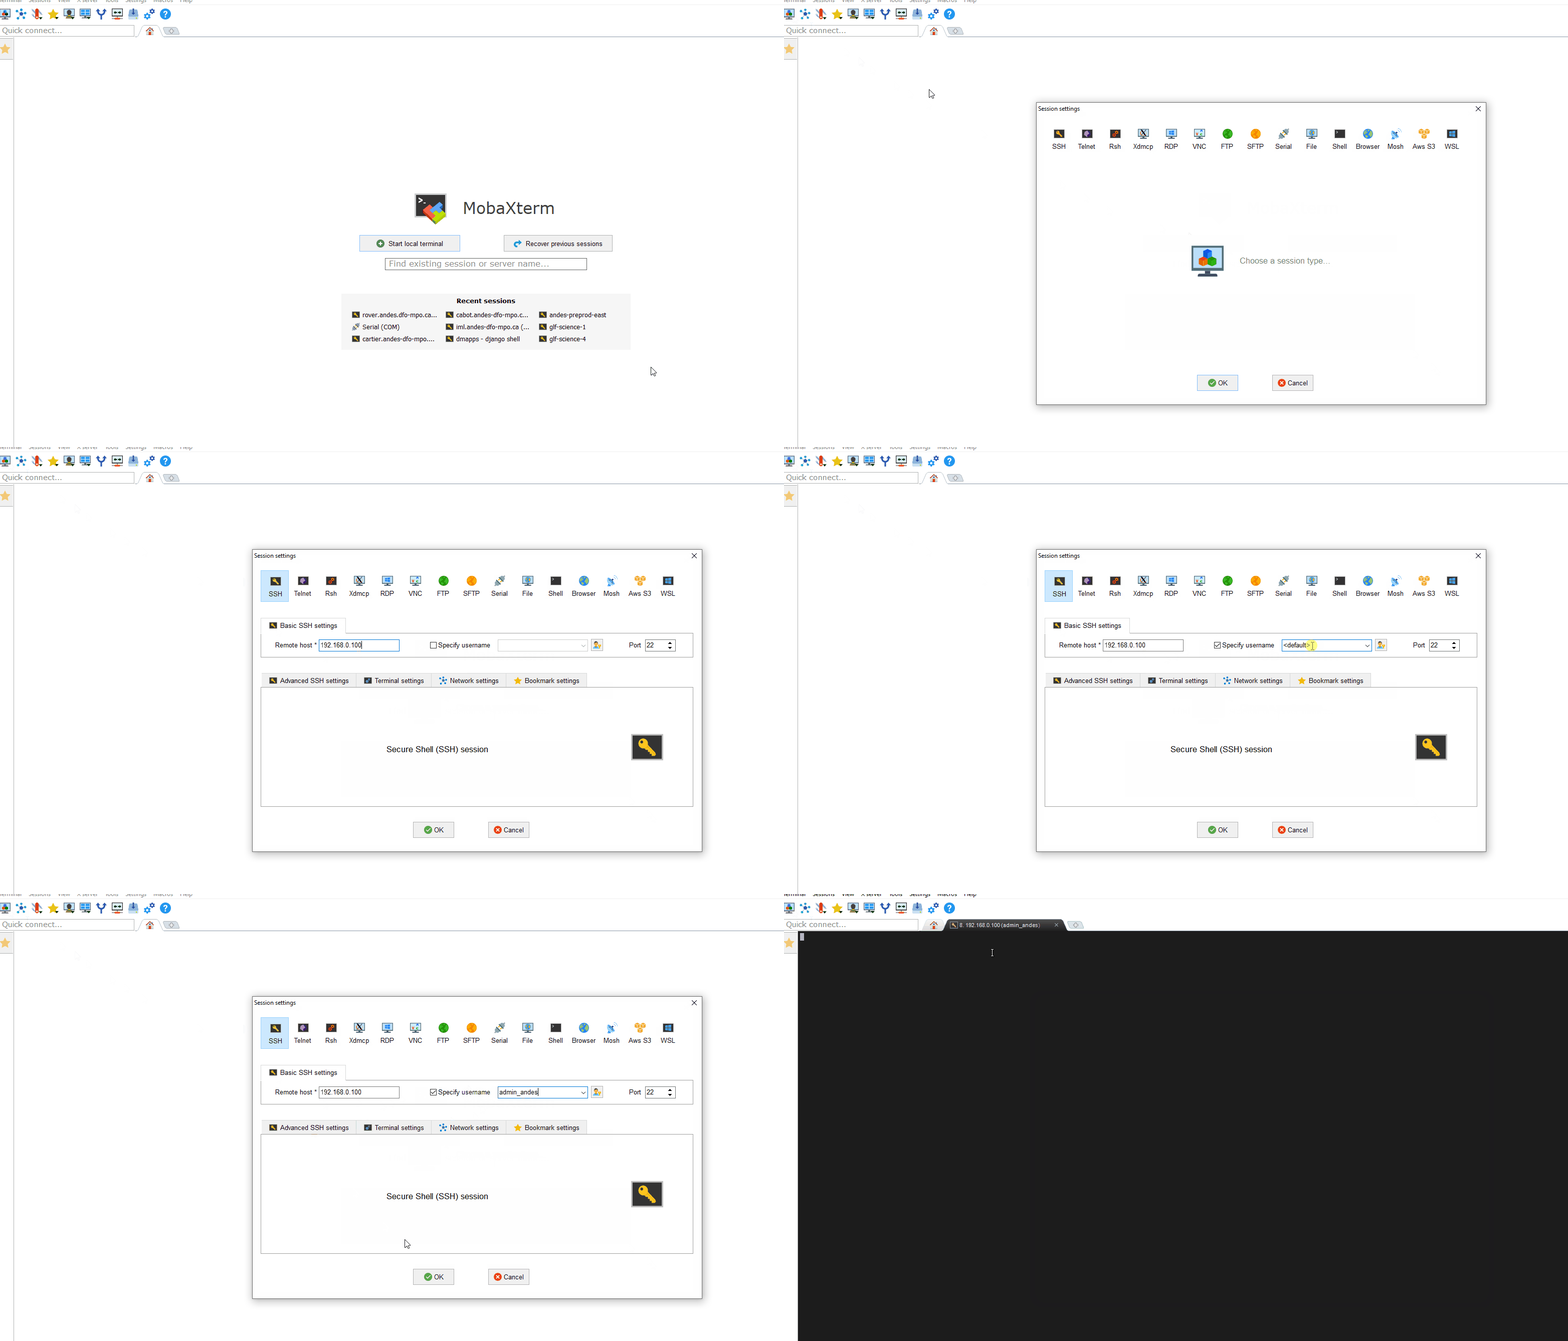
Via mobaXterm
mobaXterm is nice because you can save sessions and it is also easy to transfer files.

Viewing Server Logs
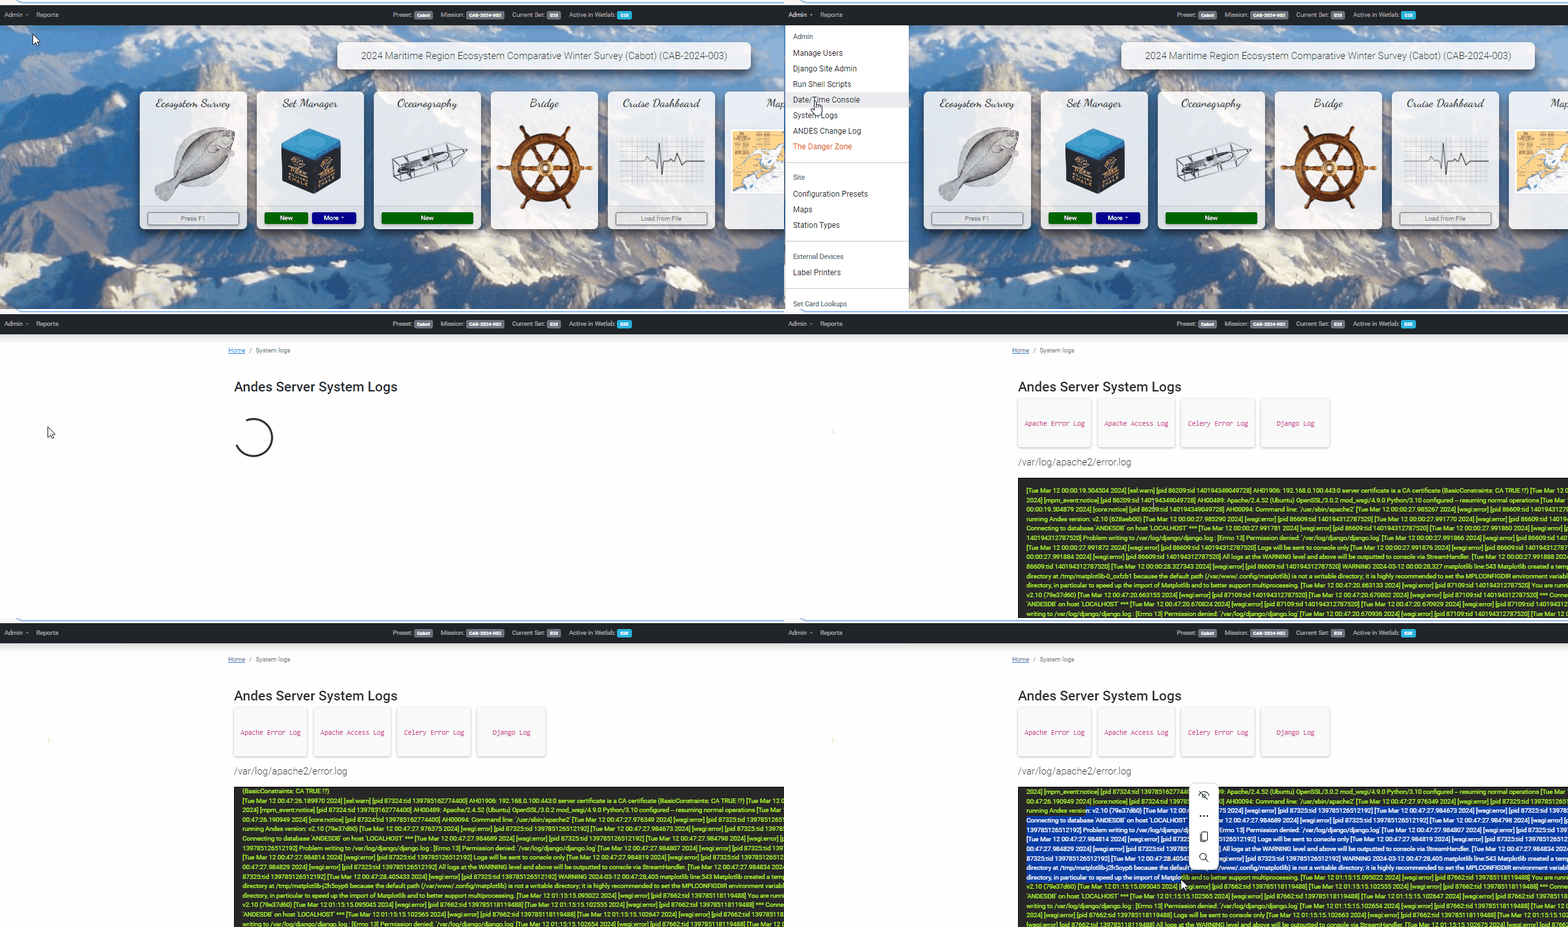
The best way to see the server logs is via the website.

If for some reason this will not work, you can view them via SSH. Connect to the server via SSH (see above). Use the following command to view the logs:
tail -n 100 /var/log/apache2/error.log
This will display the last 100 lines of the error log.